Double Jeopardy: The vaccinated are MORE LIKELY to die with COVID in this province
Hint: The name rhymes with yakisoba
Displayed prominently on Manitoba’s COVID-19 landing page is a figure that claims individuals who are “not fully vaccinated” are six times as likely to be hospitalized with COVID-19, seven times as likely to be admitted to an intensive care unit, and 16 times as likely to die with COVID-19. If it had not been for the last two years of gaslighting, I might have given them the benefit of the doubt.
That update was posted on March 31, they might say.
Things may have changed, they might say.
We forgot to update it, they might say.
Bullshit!
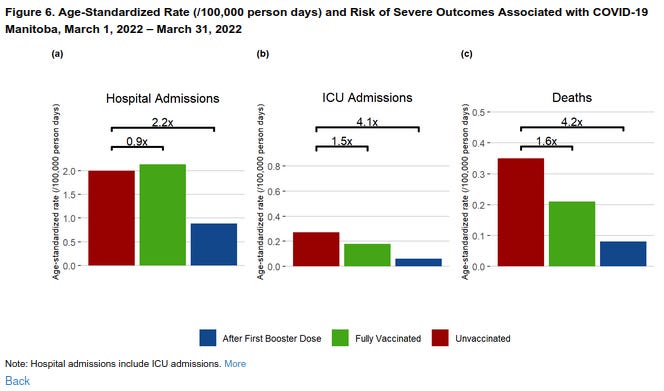
The update looks worse now, but it was a lie at the time, too. According to their own data, between March 1st and March 31st, the unvaccinated were slightly less likely to be hospitalized than the “fully vaccinated” (0.9x) and only slightly more likely to end up in the ICU (1.5x) or die (1.6x). Remember, they claimed on March 31st that the unvaccinated were 16x more likely to die meaning they were off by a factor of 10.
And here is April 1st to April 30th. Hospitalizations remained stable (boosted became more likely to be hospitalized) and deaths looked slightly better for the vaccinated. Still, 2.4-2.5x is a far cry from 16x.
However, things really fell through for the vaccinated in May.
As you can see, the unvaccinated were almost half as likely to die as the fully vaccinated and equally likely to die as the boosted during this period. However, that is not the full story.
Manitoba suffers from the same problem that most other places around the world do. They are using inaccurate population data to calculate their vaccination rates. In short, this leads to highly inaccurate numbers in the elderly population where most of the deaths occur. For new readers, I have done many posts on this phenomenon. See:
This is so widespread that the vaccination rates on the federal health information site decided it would be prudent to obfuscate the data where vaccination rates are above 99%.
Simply put, if they published the real numbers, people might look at the data with more skepticism. They might ask questions. They might catch on.
In Ontario, we found that 675,659 people over the age of 80 had a vaccination. The population of that age group in the data the province used to calculate vaccination rates is 660,520. In fact, the analysts working on the data were well aware of this error.
Months earlier, they had been using 2021 population estimates to calculate vaccination rates; however, in order to artificially shore up vaccine efficacy following omicron, they switched to 2020 population estimates. This was after 2021 population census data became available.
How do we know that they were aware of the problem? Because when they were using 2021 population estimates, they had rates broken down for ages 60-69, 70-79, and 80+. Since it is impossible to calculate rates for a negative population, the province changed the cohorts that they reported rates for. Suddenly, only those 60+ were counted in order to mask the fraud.
Edit: I realize now I forgot to add ages in here. The age groups by row are 0-4, 5-11, 12-17, 18-29, 30-39, 40-49, 50-59, 60-69, 70-79, and 80+
The same problem occurs when using age-standardization as Manitoba does. They use 2021 population estimates to calculate their data. The vaccination rate for those 70-79 is 100.25%. Now, can someone answer how you age-standardize for that? What if someone aged 70-79 in the non-existent unvaccinated population dies?
There is another discussion on age-standardization to be had here. I will write a separate article on the topic as it gets more technical and, unfortunately, the Manitoba data has so many lags in the reporting that it is impossible for me to accurately do my own age-standardization on it. However, I suspect they grouped cohorts in the same manner Ontario did. But as you can see above, even using the census 2021 data would remedy the grouping problem.
Yet. That is not the whole story either. While Manitoba has a relatively low growth rate, the distribution of their population is shifting. People are now one year older than in 2021.
Let’s assume that everyone aged by one year. What would their vaccination rate look like then?
In the above chart, I have added a year to both 2021 census and estimate data to reflect this change. I have also assumed the same number of people were born in 2022 as 2021. The latter assumption is almost definitely false given what we have seen with birth rate declines lately, but it is inconsequential as we are only concerned about the older age groups.
As you can see, that changes the entire population dynamic by a enormous amount. In fact, one would not be able to tell we are looking at the same population at all and the vaccination rates for the age groups most likely to die with the virus fall off a cliff.
I can already hear the critic’s voices saying we got you. After all, people in those age groups are dying so we can’t just add a year, right? The thing is most people simply do not die from or with COVID-19. Even a highly effective vaccine makes very little difference in raw death totals. So they may be right that these new populations are lower, but they are missing one key aspect. The vaccinated are dying too. And they have been dying since the vaccination rollout. And we have never taken them off the “vaccine rolls” so to speak.
Meaning, the vaccination rate is already substantially lower than the official rate, and this has never been accounted for. Whereas me adding a year onto the ages in the population only requires I make the assumption that the vaccinated and unvaccinated are dying at similar rates, and if they aren’t, that deaths are rare enough in even these population cohorts that the difference made is nothing more than an error term.
In sum, while Manitoba may want to believe that the fully vaccinated are only dying with COVID at slightly less than twice the rate as the unvaccinated, and the boosted are dying at the same rate, neither is true. Because they are standardizing age using the wrong population denominators, which favor the vaccinated to a high degree, the vaccinated are actually dying at higher rates. And potentially much higher rates.
Sadly, these are things that the so-called “experts” do not flag for people (if they are even aware themselves). They expect those of us watching closely to take numbers greater than 100% at face value.
Yikes.


I think what you are seeing in Manitoba is a reflection of the world that embraced these shots and is experiencing the same results. Data is going to continue to be fudged as it was from the beginning. I am continually amazed at how much data you do hunt down and extrapolate the results. Thank you for the time and energy you devote to this entire medical fiasco.
Same data fraud is going on out here in California.
Never forget, the Bad Guys would rather you died from their mistake than admit they actually made a mistake.