


A pandemic of the undead vaccinated
Age-standardization with unknown or incorrect denominators

I wanted to follow up to my Manitoba post with an example of how having incorrect population denominators can affect age-standardization. The problems that arise from incorrect denominators are similar to the problems that arise from age-specific rates with some unique characteristics. For this article, I will be using synthetic data for purposes of example.
Age-Standardization
In a nutshell, what is age-standardization? Say we want to compare the rate of a disease in two populations with different age demographics. We can normalize the rate of disease in these populations by assigning a weight based on the age demographics in a standard population. The standard population demographics can be taken from one of the two populations at hand or a third population.
Consider the simple example:
Country X:
60% of the population is under 60; and,40% of the population is over 60.
Country Y:
50% of the population is under 60; and,50% of the population is over 60.
For both countries, the rate of cancer is 5 in 100,000 for those under 60 and 30 in 100,000 for those over 60. However, the crude rate per 100,000 in both countries is different because the demographics are different.
The crude rate of cancer in Country X is 15 per 100,000 for the entire population1; whereas, in Country Y it is 17.5 per 100,000 for the entire population2. The difference is entirely due to Country Y having an older population.
But what if Country Y had the same age demographics as Country X? Then the rates of cancer in both populations would be exactly the same at 15 per 100,0003.
This is done by simply taking the proportion of ages in Country X, 50%, and multiplying it by the rates in Country Y.
Simple enough, right? The “expert” argument for using age-standardized rates has been to avoid a scenario where the crude rate in the vaccinated population is much higher than the unvaccinated population due to the vaccinated population being older.
Obviously, you’ll have to forget the fact that the experts spent nearly a year locking down the world while ignoring age demographics. Also, forget the idea that even with a working vaccine, the fact that the vaccinated were at a higher risk of hospitalization and death due to age demographics than the young and unvaccinated is why vaccine passports were so ridiculous in the first place. We don’t talk about those things here!
So, what is my gripe with age-standardization?
Denominators.
Like with all things COVID, statistical errors that would have been mundane have been magnified due to the incompetence and limitations of the people in charge of the data. Rates require knowledge of the population at risk. Populace at risk is taken from population estimates. These estimates are extrapolated from census numbers. As a rule, the further from the census, the more inaccurate the numbers.
In Canada, we have a rapidly aging population. If you look at any population projection, you’ll start to see the population pyramid that is associated with the baby boomers is becoming inverted. In other words, older populations are growing and younger populations shrinking. So having inaccurate numbers, will impact the elderly population the most.
As it turns out, most population numbers used in the COVID era were about as far from the census as possible. We have seen this in the Canadian numbers where most populations are based on 2020 estimates or 2021 non-census estimates, New Zealand numbers (who have a census in 2023), New York numbers (using 2019 population estimates that were wildly different than the census numbers), and so on. This is best shown by asking the question: are the population estimates reasonable given what we know about vaccination rates?
The short answer is no. These countries, provinces, states, and even into the municipal level all have something in common in the older age groups: vaccination rates greater than 100%.
In our cancer example above, inaccurate population estimates would be a problem, but not necessarily a large problem. However, where the problem traditionally has been magnified, and a good statistician would have pointed this out prior to 2021, occurs in age intervals with smaller populations. As populations get smaller, the impact that errors in population estimates get larger, and the variability in rates increases exponentially.
Small populations are a problem because, with vaccination rates, we are partitioning already small populations into chunks. In our cancer example, we were comparing countries. With COVID, we are working within countries, within provinces, within states, and sometimes at the local level. Some data sets are even more unclear. Take the CDC, who also age-standardize their data and as a rule only give rates. They claim to use certain states for their age-adjustments; however, the deeper you dive into their data, it becomes more unclear whether they mean states or participating health authorities within states4.
As if partitioning small populations into chunks was not enough, the unvaccinated rate is widely considered to be the population estimate less the vaccinated population. In other words, if the vaccinated population is over 100%, then the unvaccinated population is essentially negative. To take one example, for those 80-84 in New Zealand, the vaccination rate is 104.5% or about 4,300 more vaccinated people than the estimates suggest.
Where did these people come from?
But, perhaps more importantly, where do these numbers go?
They are usually taken from the unvaccinated in another age group. When we are talking about very small populations of unvaccinated to begin with, under-counting them by thousands is extremely significant as I will show. It is also unlikely that any age group has 100% vaccinations barring the government going door to door with needles. These represent an unknown number of unvaccinated who are also not counted in unvaccinated denominators.
Furthermore, the vaccinated population never decreases even when a vaccinated person dies. In older age groups, this number will also be significant, perhaps numbering in the thousands as well. And what if the population estimates are ever adjusting to be closer to the current year? Due to the way of calculating the unvaccinated population, the vaccinated dead, when reporting rates, is counted as an unvaccinated dead. Meaning, we may well have a pandemic of the undead vaccinated.
In the New Zealand example, one could easily imagine this under-counting the unvaccinated in the elderly population by an order of magnitude.
Now, nothing I have stated is particularly new if you’ve been reading my substack for awhile. The specific problem with age-standardized rates is they help to mask this effect. Even if disease rates are similar in every age group except the elderly, where population is poorly estimated, the age-standardized rates will be wildly different. If, as in Manitoba’s case, some information is missing like unvaccinated deaths, say, then it becomes difficult to know if the unvaccinated are much worse off or if the entire rate is due to a denominator error.
Consider these two scenarios:
Scenario A:
Using old census data, a province’s population is distributed as such:
There are 50000 people aged under 60 years old; and,5000 people over the age of 60.
In the province,
40000 people aged under 60 years old have been vaccinated with an 80% vaccination rate meaning 10000 unvaccinated are left; and,4750 people aged above 60 have been vaccinated with a 95% vaccination rate meaning 250 unvaccinated are left.
With,
10 deaths occurring in the vaccinated over 60, 4 deaths occurring in the vaccinated under 60; and,2 deaths occurring in the unvaccinated over 60, 1 occurring in the unvaccinated under 60.
If we calculate age-standardized rates, using the vaccinated as the standard population, then the age-standardized death rates become 93.9 for the unvaccinated and 31.3 for the vaccinated.
Scenario B:
However, the province decides to update their figures using the latest census data. In the newest census, everything remains the same, except there are 500 more people in the over 60 category.
Less than a 1% increase in the overall population from census to census, in our example, leads to drastic changes in the results. The over 60 category instead of being 95% vaccinated was actually 86.4% vaccinated and the new age-standardized rates become 37.2 for the unvaccinated and 31.3 for the vaccinated.
In fact, the population distribution I chose, while arbitrary, is not entirely different from those actually at risk from the virus (~10% of the population) based on age and with the rapid aging of the population, even the census change in Scenario B is mild. As we have seen, the results are wildly different for such a small change.
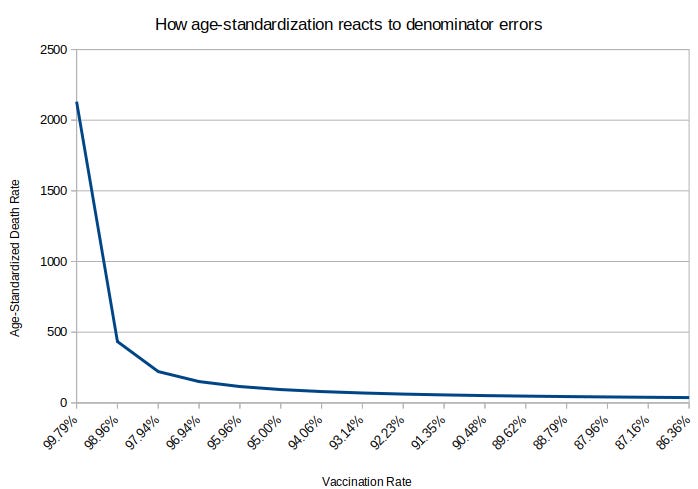
But more importantly, the resulting difference in rates gets larger and larger the closer to 100% vaccination rates one gets. Observe the graph below holding all of the variables in Scenario A and B constant except the population of those over 60. The far left end of the graph has an unvaccinated population of 10 and the right end of the graph an unvaccinated population of 750. Except the interval from 10 to 50 all other changes along the x-axis represent a 50 population increase. Small errors at the margin make a huge difference. In the case of moving from 50 to 10 people, decreasing the unvaccinated population by less than 0.5% and the entire population by less than 0.1% leads to an almost 5x increase in death rates.
Please let me know if you have any questions. I personally think using incorrect denominators is the biggest scandal of the pandemic and made most of the tyranny possible — I also think misuse of denominators is their most likely way of justifying bringing back vaccine passports in the fall.
Edit: The original e-mail listed 4500, not 4750 as the vaccinated over 60 population in Scenario A; fixed it, all the other numbers were correct, I just made a typo in this post!
Edit2: Age-intervals also matter and can make a qualitative and quantitative difference. Consider the case where there is a third age group in Scenario A, 0 to 18 years old with 20000 vaccinated being removed from the under 60 group and 3000 unvaccinated being removed. Death remain the same. This alone changes the age-standardized death rate. Or choosing age-intervals to make it so 2 deaths occur in the larger group and 1 in the small group for the unvaccinated makes a radical difference.
60% multiplied by 5 in 100,000 plus 40% multiplied by 30 in 100,000 = 15 per 100,000
50% multiplied by 5 in 100,000 plus 50% multiplied by 30 in 100,000 = 15 per 100,000
Conversely, if we assumed Country X had the same age demographics as Country Y, the rate in both countries would be 17.5 per 100,000.
For their part, the CDC recognizes that over 100% vaccination rates are ridiculous and sets an arbitrary cap at 95% when age-adjusting. I don’t know what this does to the data, quite frankly. The way their data is presenting is not transparent to an outside observer, in my opinion.
Thanks for going into the details.
They really are pulling all the stops to protect these crappy products. Good Lord, the desperation is leaving no stone unturned in their scam.
I personally think that data needs to be collected and interpreted by an organization that has no conflicts of interest. It has been shown multiple times that the CDC, FDA , Pfizer and Moderna are incapable of collecting unbiased objective data and relaying it in a transparent manner.
I understand trying to disprove their claims using their own data as a clear, elegant, logical counter argument. This action inadvertently acknowledges their data and gives it validity.
In regards to your article, I would take it a step further. If a government is unable to keep track of population information through birth/death certificates, all information and statistics involving population data becomes worthless. As you have stated, slight adjustments to the denominator can lead to false conclusions and catastrophic decision making. Its better to have no data than polluted data.